What is item analysis?
Item analysis is one of the most important things to do when working with tests and exams. It flags poor quality items (another name for questions) and allows you to review them and improve the quality of the test.
Item analysis looks at the performance of each item within a test or exam. It can identify items which may not contribute to what the test is seeking to measure. Removing or improving such weak items makes the assessment more valid and reliable.

Item analysis is something that you should be doing within every serious test or exam program. Although psychometricians can get more meaning from item analysis than ordinary practitioners, basic item analysis can and should be done by everyone. If you don’t conduct regular item analysis, then the results of tests and exams may well not be trustworthy.
Item analysis can be done when using Classical Test Theory or IRT (Item Response Theory, but this article explains and introduces item analysis within Classical Test Theory.
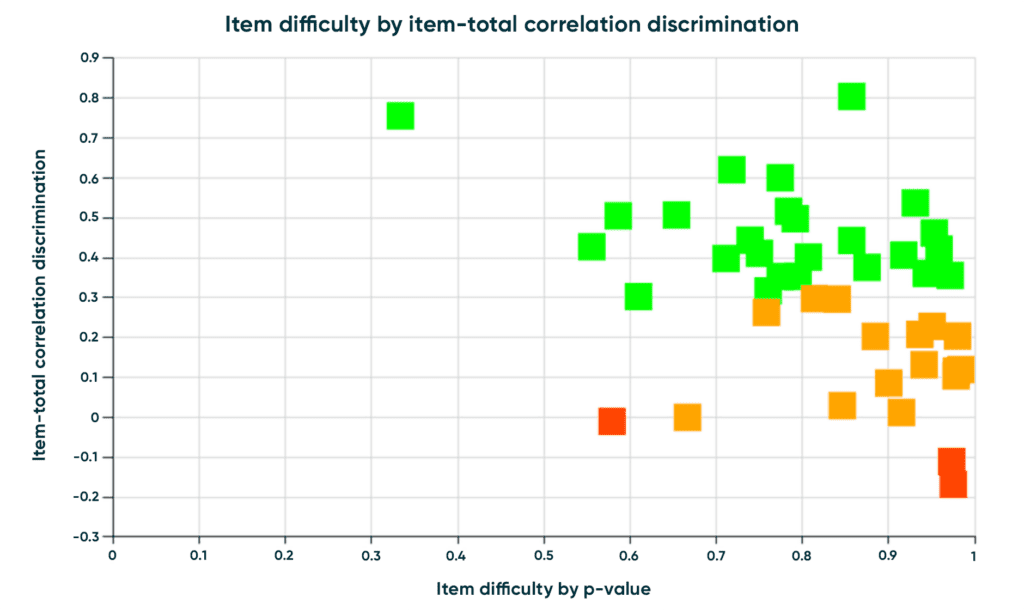
Here is a simple example of an item analysis report output. In this example, from Questionmark’s item analysis report, each item is plotted on a graph using difficulty and discrimination (terms which we will describe below). Most items are color-coded green, which means that they meet acceptable criteria but some are color-coded amber and red, which means that they need investigation.
Quick links

Why is item analysis useful?
Here are three key ways that item analysis can help a test program:
- Item analysis identifies weak questions to review and improve, for example, mis-keyed questions, ambiguous questions or questions that are irrelevant to the subject of the test.
- Item analysis can improve questions by helping remove weak distractors from multiple choice and similar questions. For example, you can remove or /change a choice that no one chooses or identify misleading or ambiguous choices. By doing this, it also reduces test-takers’ ability to guess.
- Item analysis builds confidence in your assessments and helps make them more reliable, valid, fair and trustable. It will also show stakeholders and reviewers that you are following good practices.
For more information on why valid and reliable tests matters, take a look at our dedicated article: What is the Difference between Reliability and Validity?
Are questions flagged by item analysis always bad?
Item analysis is not a magic wand. It highlights questions that might be weak or ambiguous. But bad items can have good stats and vice versa.
The value of item analysis will also depend on the sample of results you are looking at. You also need enough results, having 50+ is helpful and 100+ best.
And as well as conducting item analysis, you also need to review items in other ways, e.g. for content and bias.
What item analysis will do is identify items taking up unnecessary space in your assessments or that may weaken your assessment.
Item difficulty
One part of item analysis is calculating how easy or difficult each item is. A common way of determining how easy or hard a question is is the p-value.
This is a number between 0 and 1, and roughly speaking is the % of people in a sample who have taken the assessment who get a question right. The higher the p-value, the easier a question is.
Differing p-values in a test are normal and acceptable. For norm-referenced tests, a wide range of p-values is helpful to differentiate between test-takers. For criterion-referenced tests, p-values around the cut-score are helpful (e.g., often between 0.6 and 0.8). The table below shows some guidance for p-values:
p-value | What it means |
|---|---|
| 0 | No-one gets the question right |
| <0.25 | Very hard question, most people get it wrong. Consider if it should be used. |
| 0.25 to 0.9 | Medium level – may be acceptable to use |
| >0.9 | Very easy question, almost everyone gets it right |
| 1.0 | No one gets the question right |
What are common reasons for questions to be difficult or easy?
Common reasons for questions being difficult (with low p-value) are:
- Obscure content and/or has not been taught
- Poorly worded or confusing item
- Delivered at the end of a timed test, so test-takers answer quickly
- Question scored wrongly
- Question has two choices that are both right
And common reasons for questions being easy (with high p-value) are:
- Well-known content
- Item has been exposed and shared
- There is a clue in the item on what the right answer is
- There are poor distractors so it’s easy to guess
Get in touch
Find out more and unlock the full potential of your assessments.
Is it okay if some questions are difficult to answer?
Yes, but this is not that common.
Typical reasons for using very difficult questions might be that you need to assess a wide range of abilities and so include some hard questions. It may also be that the question is needed by the blueprint, e.g. for content coverage, and it’s one of the only ones available. Also if the job needs very high performance (e.g. you are recruiting an astronaut), you may need very difficult questions.
Is it okay if some questions are very easy to answer?
Yes, this is more common. Some typical reasons are:
- When you need to assess a wide range of ability
- To build confidence or reduce anxiety
- For retrieval practice (answering questions helps give practice retrieving which aids long-term retention)
- If it’s needed by the blueprint and deemed important, even though nearly everyone knows the answer
- For compliance/health & safety questions – most people get it right, but if someone gets it wrong, you want to flag
Item analysis and multiple choice distractors
Another use of item analysis is to look at results from a multiple choice question to review distractors. Analysis reports vary but here is a typical analysis. It shows a 4-choice question where C is the right answer. The report shows the number of people who choose each option, and how this breaks down between the upper 27% of participants (by overall score on the test), the lower 27% and the middle 46%.

What can we see from this table? One minor point is that choices B and D are not that commonly selected. If a distractor is not being selected, it could be a candidate for improvement. Good distractors often match common misconceptions or mistakes.
But a more major point is that if you look at the highlighted cell, choice A is selected by a lot of participants who score highly on the test. Of the top performers, over half (55.2%) choose option A even though option C is right. This could be an issue of more competent people over-thinking but it may well be that there is a case where A could be right, which was not considered in item-writing. The question and the choices need careful review.
Item discrimination – how well a question contributes to the test score
Suppose you have a test on engineering, but a question slips in that requires knowledge of something else to answer it, let’s say baseball. Clearly, that question will reduce the value of the total test score since knowledge of baseball is not relevant to an engineering test.
Item analysis can identify questions that are like this, where the results for that question do not match the rest of the test. It’s possible to look at test-takers who get a question correct, how well they do on the test as a whole, and work out a “correlation” between the two.
One such correlation statistic is called item discrimination. It is a number from -1.0 to +1.0 and compares how the score for an item compares to the score for the assessment. The higher it is, the better the item helps contribute to the assessment result.
Items with good discrimination improve the assessment’s ability to discriminate between test-takers of different ability levels. Item discrimination is influenced by p-value so expect lower values on very hard or very easy items. Items with low or negative discrimination may lower the reliability of an assessment or threaten validity (like the baseball example).
What discriminations are acceptable will depend on a variety of factors, but it’s usual to review questions with item discriminations of less than 0.2, and sometimes you will want to look at ones higher than this.
Some possible reasons for a question to have a low item discrimination are:
- Item is very easy
- Item is very hard
- The item correct answer is awry or there is more than one correct answer
- The item is ambiguous or poorly written
- High-performing test-takers are overthinking the item
- The item is measuring a different construct than other items
- Low sample size
Reviewing questions with low item discriminations and improving where needed will usefully improve the quality of a test.
A summary of item analysis
To summarize, there are three very useful reviews to conduct with item analysis.
- Look at the difficulty of each question and review questions that are too easy or hard.
- Look at the statistics for each multiple choice question in case some distractors are rarely chosen or some choices are chosen too often by an unexpected group of test takers.
- Look at the item discrimination of each question and review questions where this is low.
Item analysis is a mechanical process and doesn’t know your subject area. There are many things that can impact the statistics – partially scored questions, too few answers, issues in the sample of people who have taken the assessment, too few items in the assessment, that the assessment has different parts that don’t correlate together and some statistical edge cases. Item analysis is a very useful guide, but if a question is flagged that you still think is appropriate, you can keep it
Taking it further
There is lots more that can be done with item analysis – you can look for example at item reliability, which is how much the item is contributing to total score variance, the higher the better. Or you can look at item rest correlation discrimination, which is an alternative to item discrimination that works better for smaller assessments and small sample sizes. You can also perform differential item functioning (DIF) which can help find bias in items.
But the above three steps will be very useful and get a lot of value to improve the quality of your tests.