In classical test theory, a common item statistic is the item’s difficulty index, or “p value.” Given many psychometricians’ notoriously poor spelling, might this be due to thinking that “difficulty” starts with p?
Actually, the p stands for the proportion of participants who got the item correct. For example, if 100 participants answered the item, and 72 of them answered the item correctly, then the p value is 0.72. The p value can take on any value between 0.00 and 1.00. Higher values denote easier items (more people answered the item correctly), and lower values denote harder items (fewer people answered the item correctly).
Typically, test developers use this statistic as one indicator for detecting items that could be removed from delivery. They set thresholds for items that are too easy and too difficult, review them, and often remove them from the assessment.
Why throw out the easy and difficult items? Because they are not doing as much work for you. When calculating the item-total correlation (or “discrimination”) for unweighted items, Crocker and Algina (Introduction to Classical and Modern Test Theory) note that discrimination is maximized when p is near 0.50 (about half of the participants get it right).
Why is discrimination so low for easy and hard items? An easy item means that just about everyone gets it right, no matter how proficient they are in the domain; the item does not discriminate well between high and low performers. (We will talk more about discrimination in subsequent posts.)
Sometimes you may still need to use a very easy or very difficult item on your test form. You may have a blueprint that requires a certain number of items from a given topic, and all of the available items might happen to be very easy or very hard. I also see this scenario in cases with non-compensatory scoring of a topic. For example, a simple driving test might ask, “Is it safe to drink and drive?” The question is very easy and will likely have a high p value, but the test developer may include it so that if a participant gets the item wrong, they automatically fail the entire assessment.
You may also want very easy or very hard items if you are using item response theory (IRT) to score an aptitude test, though it should be noted that item difficulty is modeled differently in an IRT framework. IRT yields standard errors of measurement that are conditional on the participant’s ability, so having hard and easy items can help produce better estimates of high- and low-performing participants’ abilities, respectively. This is different from the classical test theory where the standard error of measurement is the same for all observed scores on an assessment.
While simple to calculate, the p value requires cautious interpretation. As Crocker and Algina note, the p value is a function of the number of participants who know the answer to the item plus the number of participants who were able to correctly guess the answer to the item. In an open response item, that latter group is likely very small (absent any cluing in the assessment form), but in a typical multiple choice item, a number of participants may answer correctly, based on their best educated guess.
Recall also that p values are statistics—measures from a sample. Your interpretation of a p value should be informed by your knowledge of the sample. For example, if you have delivered an assessment, but only advanced students have been scheduled to take it, then the p value will be higher than it might be when delivered to a more representative sample.
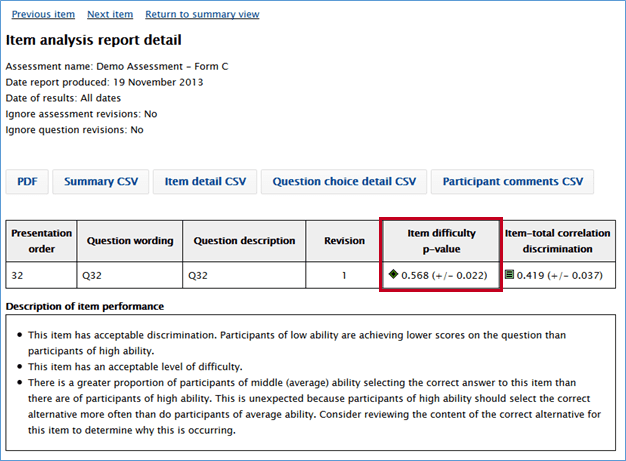
Since the p value is a statistic, we can calculate the standard error of that statistic to get a sense of how stable the statistic is. The standard error will decrease with larger sample sizes. In the example below, 500 participants responded to this item, and 284 participants answered the item correctly, so the p value is 284/500 = 0.568. The standard error of the statistic is ± 0.022. If these 500 participants were to answer this item over and over again (and no additional learning took place), we would expect the p value for this item to fall in the range of 0.568 ± 0.022 about 68% of the time.