We previously discussed item difficulty (p value), and we talked about how item difficulty relates to item discrimination. Today, let’s move on to Item discrimination—the other item-level statistic commonly used to describe item performance.
While there are several ways to quantify discrimination, test developers commonly use correlational indices to create item discrimination statistics.
In Introduction to Classical and Modern Test Theory, Crocker and Algina explain that item discrimination (sometimes referred to as “differentiation”) is an important tool in the need to identify construct-level differences between individual participants. Those differences are typically measured by a participant’s total score on the assessment.
If we want to quantify the differences between participants with total scores, we need to build an assessment with items that discriminate well between high-scoring and low-scoring participants. We expect our high-scoring participants to have a higher probability of answering any given item correctly. When we observe the opposite (low-scoring participants having a higher probability of answering an item correctly), then the item may not be measuring the same construct that the assessment is purportedly measuring.
The Questionmark Item Analysis Report returns the item-total correlation, which is the Pearson product moment coefficient between the responses for the reported item and the participants’ total test scores. This is a correlational index, so values can range from -1.00 to 1.00. Higher positive values for the item-total correlation indicate that the item is discriminating well between high- and low-performing participants. Negative values mean the opposite: low-performing participants are more likely to get the item correct. Values near zero indicate that the item is not discriminating between high- and low- performing participants—that all participants have similar probabilities of answering the item correctly, regardless of their total assessment score.
The Pearson product moment coefficient is the correlation between an item’s scores and the total test scores, but the total test score is derived partly from that item’s score. By answering the item correctly, a participant automatically increases his or her total score.
This rarely presents an issue when all items are scored the same way and the test form is suitably long (Crocker and Algina suggest 25 items or more). When the form is short, each item proportionally contributes more to the total score, thus creating a self-fulfilling prophecy of sorts: if you get one item correct on a two-item form, you are already well on your way to being a high-scoring participant.
The same is true for assessments where one item is weighted more than others. For example, if one item on the test is scored (0, 20) and the others are scored (0, 1), then people who answer the weighted item correctly automatically score 20 points higher in their total score. This presents a departure from the point we discussed in the item difficulty post, where I mentioned that item discrimination is maximized for items of medium difficulty. When an item is weighted, it may have a very high discrimination even when it has high difficulty, as is shown in the figures below.
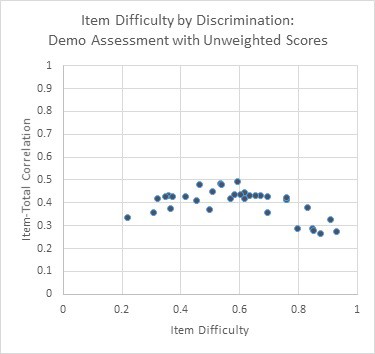
35 dichotomous items scored (0, 1), plotted by item difficulty and item-total correlation, with highest discrimination values occurring near p = 0.500.
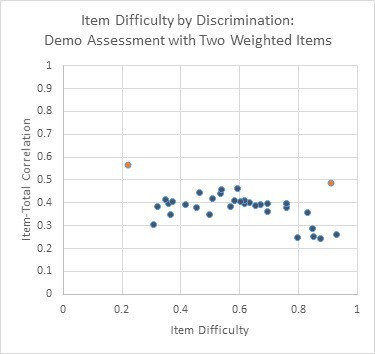
35 items plotted by item difficulty and item-total correlation, with one difficult item (p = 0.218) and one easy item (p = 0.908) scored (0, 10). Note that the other items’ correlation values have shifted.
Another consideration for discrimination statistics is the sample size. Small sample sizes will lead to unstable correlation coefficients in any scenario, but they are particularly an issue in the case of item-total correlation. Monika Verzaal at the Netherlands Association of Universities of Applied Sciences notes that small sample sizes can lead to increased item variance, which in turn increases the total test score variance, both of which will affect the magnitude of the item-total correlation.
To accommodate these issues with the Pearson product moment coefficient for the item-total correlation discrimination, some test developers prefer to use the item-rest (sometimes referred to as “item-remainder”) coefficient instead. The interpretation of the statistic is the same, but the item-rest coefficient excludes the reported item’s contribution to the total score when calculating the correlation, so the item variance is not biasing the magnitude of the item-rest coefficient.
For more information, please contact us.