Discover powerful, flexible, and accessible assessments supported by Learnosity’s gold-standard assessment engine.
Blog
From assessment best-practice to the power of certifications, our blog has a range of topics built with you in mind
Explore everything
The anatomy of a successful certification program in an AI world
Join Questionmark’s Chief Product Officer, Neil McGough, as he discusses the challenges in creating a successful certification program in an AI world…
The anatomy of a successful certification program in an AI world
Assessments Just Got Advanced
Discover powerful, flexible, and accessible assessments supported by Learnosity's gold-standard assessment engine.
Assessments Just Got Advanced
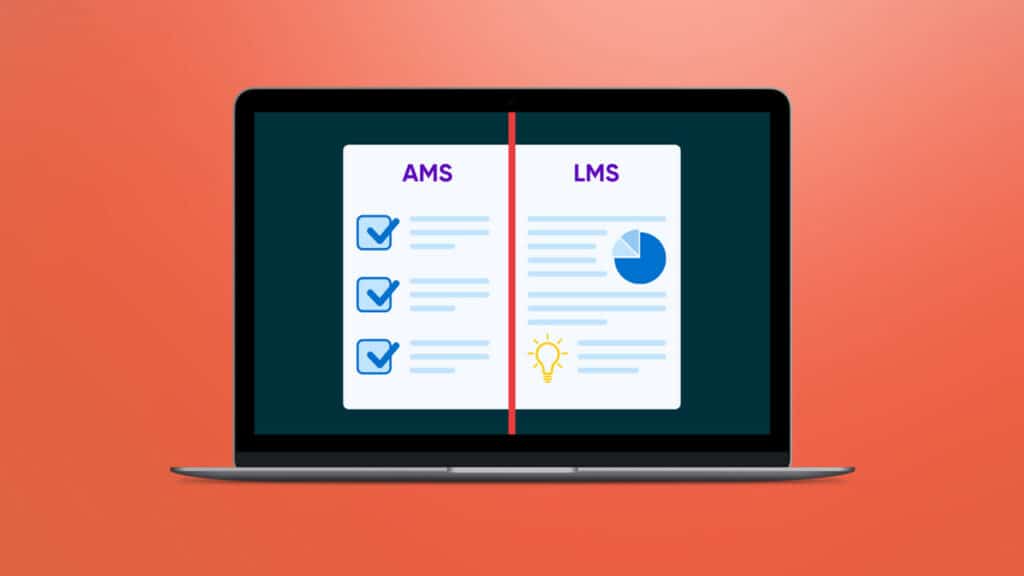
Does Your LMS Need an Assessment Management System?
Does your LMS need an Assessment Management System? Here's complete breakdown to help you find out.
Does Your LMS Need an Assessment Management System?

Workplace Learning: The value of continuous L&D in the workplace
The best kind of learning is rarely a one-and-done venture. Discover the power of continuous learning within the workplace and why it matters.
Workplace Learning: The value of continuous L&D in the workplace

L&D in the Age of AI: Six ways assessments help make L&D future-proofed
How do you make learning and development future-proofed, or at least future-resistant? Discover how to future-proof L&D in the era of AI.
L&D in the Age of AI: Six ways assessments help make L&D future-proofed

Turbocharge Your LMS for Impact
Elevate the impact of your LMS with valid, and reliable assessment software that integrates seamlessly for rich & relevant data insights.
Turbocharge Your LMS for Impact

Six Steps to Building a Continuous Learning Culture
Learn how to build a continuous learning culture in the workplace with these 6 simple steps. Discover the benefits of continuous learning.
Six Steps to Building a Continuous Learning Culture

What are Behavioral Competencies?
Discover the importance of behavioral competencies in the workplace. Learn about examples, core and functional competencies, and example assessments.
What are Behavioral Competencies?

The Difference Between Learning and Development
Understanding the difference between learning and development is crucial for individuals and organizations to create effective strategies.
The Difference Between Learning and Development