In our discussion about correlational item discrimination, I mentioned that there are several other ways to quantify discrimination. One of the simplest ways to calculate discrimination is the High-Low Discrimination index, which is included on the item detail views in Questionmark’s Item Analysis Report.
To calculate the High-Low Discrimination value, we simply subtract the percentage of low-scoring participants who got the item correct from the percentage of high-scoring participants who got the item correct. If 30% of our low-scoring participants answered correctly, and 80% of our high-scoring participants answered correctly, then the High-Low Discrimination is 0.80 – 0.30 = 0.50.
But what is the cut point between high and low scorers? In his article, “Selection of Upper and Lower Groups for the Validation of Test Items,” Kelley demonstrated that the High-Low Discrimination index may be more stable when we define the upper and lower groups as participants with the top 27% and bottom 27% of total scores, respectively. This is the same method that is used to define the upper and lower groups in Questionmark’s Item Analysis Report.
The interpretation of High-Low Discrimination is similar to the interpretation of correlational indices: positive values indicate good discrimination, values near zero indicate that there is little discrimination, and negative discrimination indicates that the item is easier for low-scoring participants.
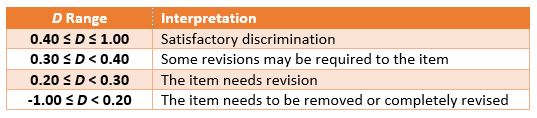
In Measuring Educational Achievement, Ebel recommended the following cut points for interpreting High-Low Discrimination (D):
In Introduction to Classical and Modern Test Theory, Crocker and Algina note that there are some drawbacks to the High-Low Discrimination index. First, it is more common to see items with the same p value having large discrepancies in their High-Low Discrimination values. Second, unlike correlation discrimination indices, High-Low Discrimination can only be calculated for dichotomous items. Finally, the High-Low Discrimination does not have a defined sampling distribution, which means that confidence intervals cannot be calculated, and practitioners cannot determine whether there are statistical differences in High-Low Discrimination values.
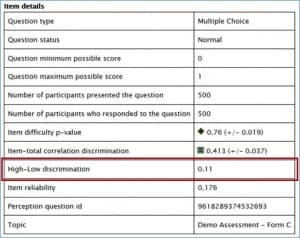
Nevertheless, High-Low Discrimination is easy to calculate and interpret, so it is still a very useful tool for item analysis, especially in small-scale assessment. The figure below shows an example of the High-Low Discrimination value on the item detail view of the Item Analysis Report.