Create, deliver, and analyze assessment and certification programs that provide essential business insights.

Assess better with Questionmark


Trusted by industry-leading organizations
Take your learning programs to new heights with better assessment tech
 Questionmark Certification
For creating and delivering smarter certification programs that scale.
 Questionmark Government
For a FedRAMP and ATO achieved assessment solution you can count on.
 Questionmark Academic
For learning supported with valid, secure, and scalable assessments
Workday Certified
 Questionmark for Workday
Power L&D success with Workday Learning and Questionmark assessments
What’s new at Questionmark?
How we enhance Workday Learning
Power L&D success and create a single, streamlined learning ecosystem with Workday Learning for Questionmark.
AI-assisted assessment news
Discover the new landscape of AI-enabled assessments and the many opportunities they offer.

Our latest resources
Build a world-class training program with the help of our reports, webinars, and insights.
New: Now more advanced
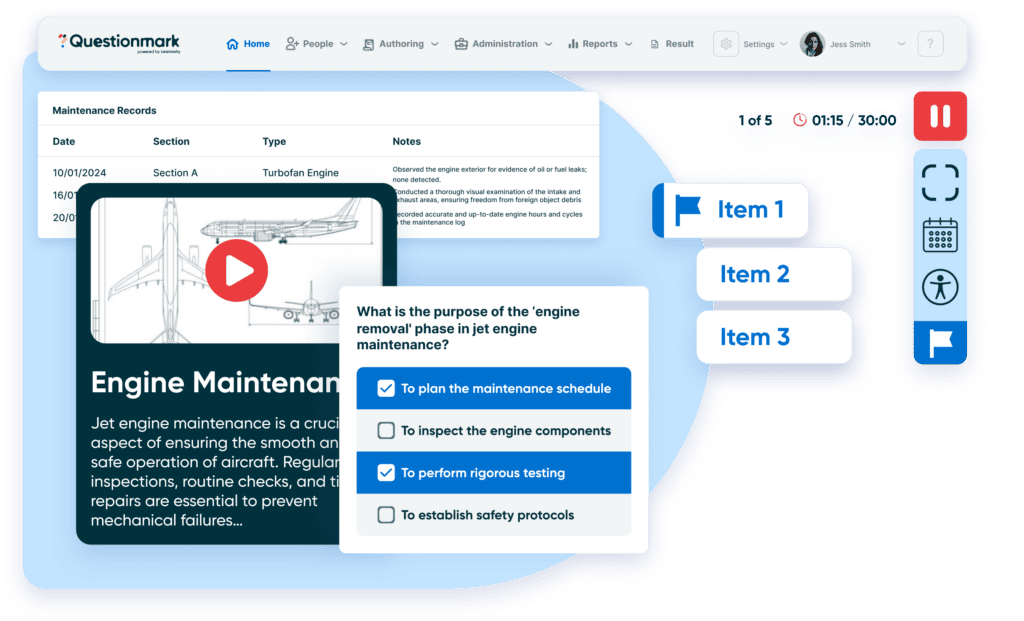
Your program, your way
You bring the vision and we bring the building blocks. Create any type of learning program and deliver it in any style that suits your needs with media-rich and dynamic authoring options. And why stop there? Level up your assessment and certification programs with translation features, proctoring solutions, observational assessments, and so much more.
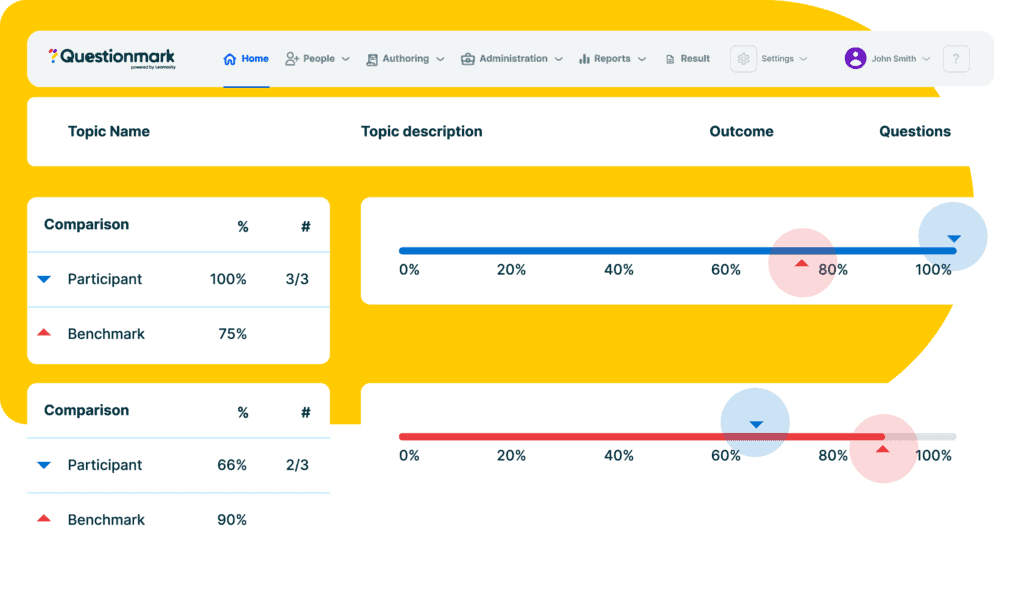
Data at your service
You’re already doing the hard part of training and teaching, so why not harness that data to better inform your next steps? Build business intelligence and drive organizational growth with high-quality data, delivered via powerful reports.
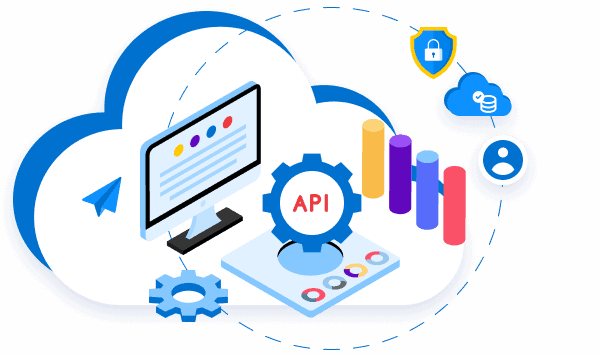
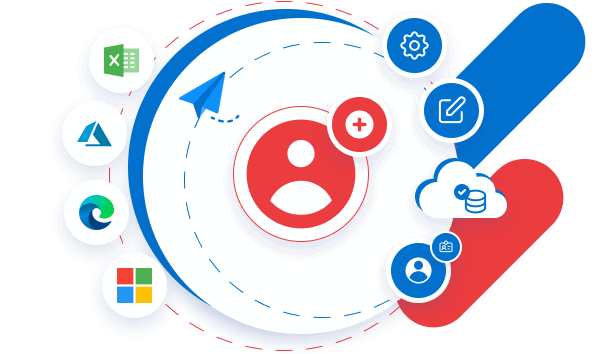
Feature-rich and friction-free
Ensure an uninterrupted experience for your learners and easier management for you, with our seamless integration features. From slotting seamlessly into your LMS to connecting effortlessly with your current tools, our streamlined platform ensures a smooth experience for all.
Expert support to springboard your success
Our products are designed to help you to hit the ground running, but that doesn’t mean you’re on your own. With a comprehensive onboarding process and ongoing support throughout your journey, we’re here to ensure you get the best from our products.
Why use the Questionmark Assessment Platform?
Our understanding of what makes a brilliant assessment program spans across sectors and organization size, meaning you get to learn and benefit from innovations driving other industries.
600 customers
Trusted by over 600 customers to run certification, training and compliance programs big and small.
30 years
Paving the way for more effective testing worldwide for over 30 years, and we’re now part of the Learnosity family.
80 Government departments
Securely delivering assessments for more than 80 global Government departments.
Award winners
Creators of award-winning and modern tools that keep customers future–facing
We had looked at many different platforms and what we found was Questionmark was the one that had everything we were looking for – various question types, the security and professionalism. We’ve had a great relationship over the years and we’re really excited to continue where we’re going.
Andrew Dominguez, Superintendent
Southwest Gas
Get in touch
Talk to the team to start making assessments a seamless part of your learning experience.