We have talked about item difficulty and item discrimination in a classical test theory framework, and we have discussed how these indices can be used to flag items that may potentially affect the validity of the inferences we make about the assessment results. Another area of item performance that is often used for item retention decisions is item bias, commonly referred to as differential item functioning (DIF).
DIF studies are generally implemented to see how the performances of two groups compare on a single item in an assessment (though studies can be done with more than two groups). One group is typically referred to as the reference group, and the other is the focal group. The focal group is the group that theory or previous research suggests may be disadvantaged by the item.
One simple method that some practitioners use is based on the four-fifths rule, which is detailed in the Uniform Guidelines for Employee Selection Procedures. This method involves comparing the correct response rates (p values) for the two groups. If the ratio of the smaller p value to the higher p value is less than 0.80, then the item may be adversely impacting the group with the lower p value. For example, if 50% of males answer an item correctly and 75% of females answer an item correctly, then 0.50/0.75 = 0.66 < 0.80, so we may be concerned that the item is adversely affecting the response patterns of males.
The four-fifths rule is attractive because it is easy to calculate, but it is prone to sampling error and misinterpretation. Continuing with our example, what if the population of males on average actually knows less about the content than the population of females? Then we would expect to see large differences in p values for the two groups because this reflects the actual differences in ability in the population.
In Differential Item Functioning (eds. Holland & Wainer, 1993), Angoff explains that DIF is occurring when an item displays different statistical properties between groups after those groups have been matched on a measure of proficiency. To put it another way, we need to first account for differences in the groups’ abilities, and then see if there are still differences in the item performance.
There are many ways to investigate DIF while accounting for participants’ abilities, and your decision may be influenced by whether or not you are using item response theory (IRT) for your student model, whether you have missing data, and whether or not the DIF is uniform or non-uniform.
Uniform DIF indicates that one group is (on average) always at a disadvantage when responding to the item. If we were to create item characteristic curves for the two groups, they would not intersect. Non-uniform DIF means that one group has an advantage for some proficiency levels, but is at a disadvantage at other proficiency levels. In this scenario, the two item characteristic curves would intersect.
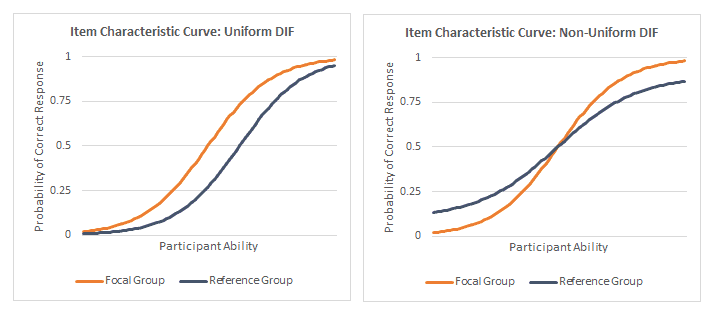
Item characteristic curves demonstrating examples of uniform and non-uniform DIF.
In my next post, I will introduce two common methods for detecting uniform and non-uniform DIF: the Mantel-Haenszel method and logistic regression. Unlike the four-fifths rule, these methods account for participants’ abilities (as represented by total scores) before making inferences about each group’s performance on an item.